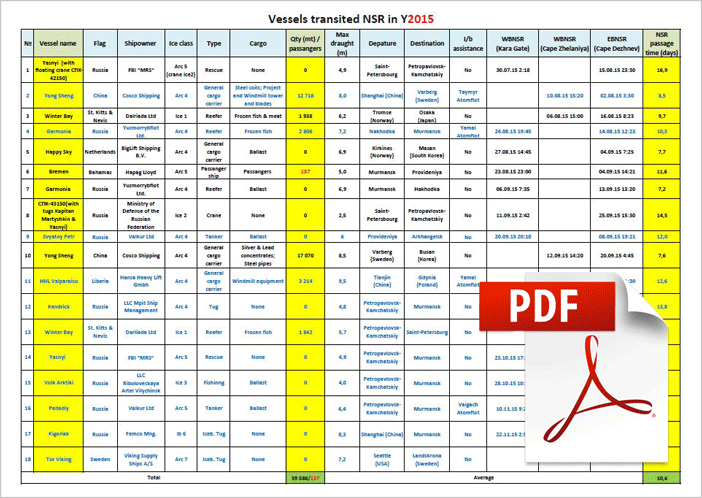
Transit statistics 2015
Referring to data from the NSR Administration we publish detailed statistics on transit voyages and overall cargo turnover at the NSR in 2015. Click to view PDF file.
| Total volume of main types of cargo transported within the NSR waters, excluding transiting at 31.12.2015 | |||||
| Total (t) | Oil & oil products | Gas condensate | Coal | Ore concentrate | Other dry cargo |
| 5 392 160 | 859 533 | 114 384 | 355 875 | 79 801 | 3 982 567 |
| delivery | |||||
| 3 937 927 | 333 740 | 319 516 | 3 284 671 | ||
| coming-out | |||||
| 1 454 233 | 525 793 | 114 384 | 36 359 | 79 801 | 697 896 |

